Here's what population change looked like in 2006 across the U.S. (population growth is red, loss is blue):

And in 2011, the map below shows where the U.S. population grew and shrank:

All but two of the 39 counties with 1 million-plus people — Michigan's Wayne (Detroit) and Ohio's Cuyahoga (Cleveland) — grew from 2010 to 2011.
- Twenty-eight of the big counties gained faster than the nation, which grew at the slowest rate since the Great Depression (0.73%). The counties' median growth rate was 1.3% (half grew faster, half slower).
- Central metro counties accounted for 94% of U.S. growth, compared with 85% just before the recession.
-------------------
Party control of Governors' offices after January 18, 2011.
Democratic Governor
Republican Governor
Independent Governor
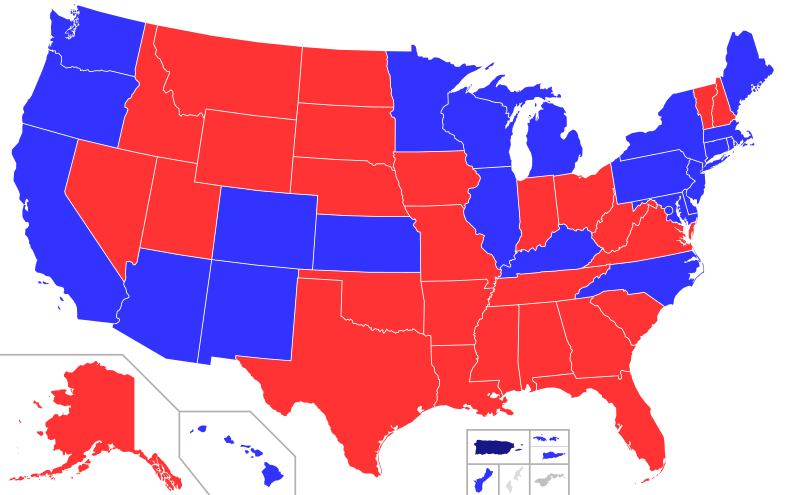
http://en.wikipedia.org/wiki/List_of_current_United_States_governors
-----------------------

http://en.wikipedia.org/wiki/List_of_U.S._states_by_unemployment_rate
----------------
http://en.wikipedia.org/wiki/List_of_U.S._states%27_largest_cities
http://en.wikipedia.org/wiki/List_of_U.S._states#Lists
http://en.wikipedia.org/wiki/State_tax_levels_in_the_United_States
http://en.wikipedia.org/wiki/List_of_U.S._states_by_fertility_rate
http://en.wikipedia.org/wiki/List_of_U.S._states_by_GDP
http://en.wikipedia.org/wiki/List_of_U.S._states_by_GDP_per_capita
http://en.wikipedia.org/wiki/List_of_U.S._states_by_income_equality
Nenhum comentário:
Postar um comentário